Deploying Prometheus to Kubernetes
In this article, we’ll use the Prometheus Operator to deploy Prometheus to Kubernetes and configure it to collect metrics from an application running multiple replicas.
This article overlaps with the Prometheus Operator Getting Started guide but provides more detail about working with Spring Boot applications.
Check out all the manifest files on GitHub https://github.com/minibuildsio/prometheus-operator-example.
Prometheus Operator Introduction
The Prometheus Operator aims to simplify the deployment and management of Prometheus in Kubernetes. It does this by introducing custom resource definitions to configure Prometheus, the two we are most interested in are:
- Prometheus: used to specify Prometheus and configure how it identifies targets to monitor.
- ServiceMonitor: defines selectors that determine which services are monitored and how they are scraped.
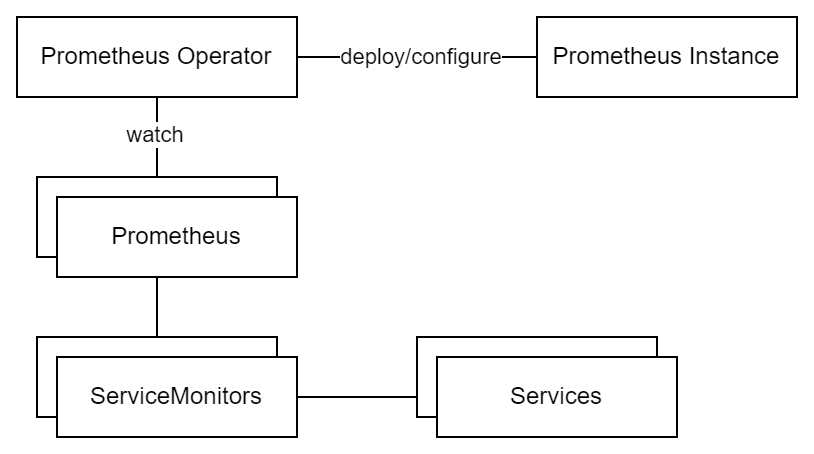
The Prometheus Operator itself watches for changes to these resources and configures the Prometheus instance based on the Prometheus and ServiceMonitor resources.
The diagram below shows a high-level view of how the resources are related to one another.
Install the Prometheus Operator Bundle
The following command with apply the latest Prometheus Operator bundle to the Kubernetes cluster kubectl is configured to apply to.
LATEST=$(curl -s https://api.github.com/repos/prometheus-operator/prometheus-operator/releases/latest | jq -cr .tag_name)
curl -sL https://github.com/prometheus-operator/prometheus-operator/releases/download/${LATEST}/bundle.yaml | kubectl create -f -

# e.g.
curl -sL https://github.com/prometheus-operator/prometheus-operator/releases/download/v0.69.1/bundle.yaml | kubectl create -f -
After the bundle has been applied, you will be able to list the custom resource definitions with kubectl get crd and see the Prometheus Operator with kubectl get pods (you may need to wait a minute for the operator to start).
Deploy a Sample Application
For the purposes of this demo, we’ll use prometheus-dummy as a stand-in for a real application that provides Prometheus metrics. prometheus-dummy provides the custom metric no_of_ticks_total which increases by 1 per second.
All of the resources for the sample application will be grouped into the metrics-app namespace which is defined below. Notice the metrics: prometheus label is used in the Prometheus resource namespace selector.
apiVersion: v1
kind: Namespace
metadata:
  name: metrics-app
  labels:
    metrics: prometheus
The deployment below spins up three instances of prometheus-dummy.
apiVersion: apps/v1
kind: Deployment
metadata:
  name: metrics-app-deployment
  namespace: metrics-app
spec:
  selector:
    matchLabels:
      app: metrics-app
  replicas: 3
  template:
    metadata:
      labels:
        app: metrics-app
    spec:
      containers:
        - name: metrics-app
          image: ghcr.io/minibuildsio/artefacts/prometheus-dummy:0.1.0
          ports:
            - containerPort: 8080
The service below exposes the pods in the deployment. Notice the app: metrics-app label this is used in the ServiceMonitor selector.
apiVersion: v1
kind: Service
metadata:
  name: metrics-app-svc
  namespace: metrics-app
  labels:
    app: metrics-app
spec:
  ports:
    - name: web
      port: 8080
      targetPort: 8080
      protocol: TCP
  selector:
    app: metrics-app
Create the ServiceMonitor
The ServiceMonitor defines which services are monitored in this case services with the label app: metrics-app. Our sample application, prometheus-dummy, provides the Prometheus metrics via the endpoint /actuator/prometheus which is configured using path in the endpoints section.
You will likely have many ServiceMonitors to help organise your ServiceMonitors they can be given labels e.g. team: backend. This allows the owner of the ServiceMonitor to be identified or irrelevant ServiceMonitors to be filtered using kubectl get ServiceMonitor -A -l team=backend for example.
apiVersion: monitoring.coreos.com/v1
kind: ServiceMonitor
metadata:
  name: metrics-app-service-monitor
  namespace: metrics-app
  labels:
    team: backend
spec:
  selector:
    matchLabels:
      app: metrics-app
  endpoints:
  - path: /actuator/prometheus
    port: web
Create Prometheus Resource
The Prometheus resource requires permissions to discover services, pods, etc. The manifests below create a service account, define the cluster role (set of permissions), and then bind them together.
apiVersion: v1
kind: ServiceAccount
metadata:
  name: prometheus
apiVersion: rbac.authorization.k8s.io/v1
kind: ClusterRole
metadata:
  name: prometheus
rules:
- apiGroups: [""]
  resources:
  - nodes
  - nodes/metrics
  - services
  - endpoints
  - pods
  verbs: ["get", "list", "watch"]
- apiGroups: [""]
  resources:
  - configmaps
  verbs: ["get"]
- apiGroups:
  - networking.k8s.io
  resources:
  - ingresses
  verbs: ["get", "list", "watch"]
- nonResourceURLs: ["/metrics"]
  verbs: ["get"]
apiVersion: rbac.authorization.k8s.io/v1
kind: ClusterRoleBinding
metadata:
  name: prometheus
roleRef:
  apiGroup: rbac.authorization.k8s.io
  kind: ClusterRole
  name: prometheus
subjects:
- kind: ServiceAccount
  name: prometheus
  namespace: default
Finally, we can tie everything together by creating a Prometheus resource. The manifest below configures Prometheus to scrape all ServiceMonitors labelled with team: backend in a namespace labelled with metrics: prometheus as specified in the serviceMonitorSelector and serviceMonitorNamespaceSelector.
apiVersion: monitoring.coreos.com/v1
kind: Prometheus
metadata:
  name: prometheus
spec:
  enableAdminAPI: false
  evaluationInterval: 30s
  portName: web
  resources:
    requests:
      memory: 100Mi
  scrapeInterval: 30s
  serviceAccountName: prometheus
  serviceMonitorNamespaceSelector:
    matchLabels:
      metrics: prometheus
  serviceMonitorSelector:
    matchLabels:
      team: backend
The Prometheus Operator will detect the new Prometheus resource and apply the new configuration to the Prometheus instance.
Expose the Prometheus Instance
The service below exposes the Prometheus instance that is managed by the Prometheus Operator.
apiVersion: v1
kind: Service
metadata:
  name: prometheus-svc
spec:
  type: NodePort
  ports:
  - name: web
    nodePort: 30900
    port: 9090
    protocol: TCP
    targetPort: web
  selector:
    prometheus: prometheus
If you’re running the demo in minikube you can expose the service outside of the cluster using:
minikube service prometheus-svc --url
Otherwise, you’ll need to set up an ingress resource, etc which is outside of the scope of this article.
View Configuration and Metrics in Prometheus UI
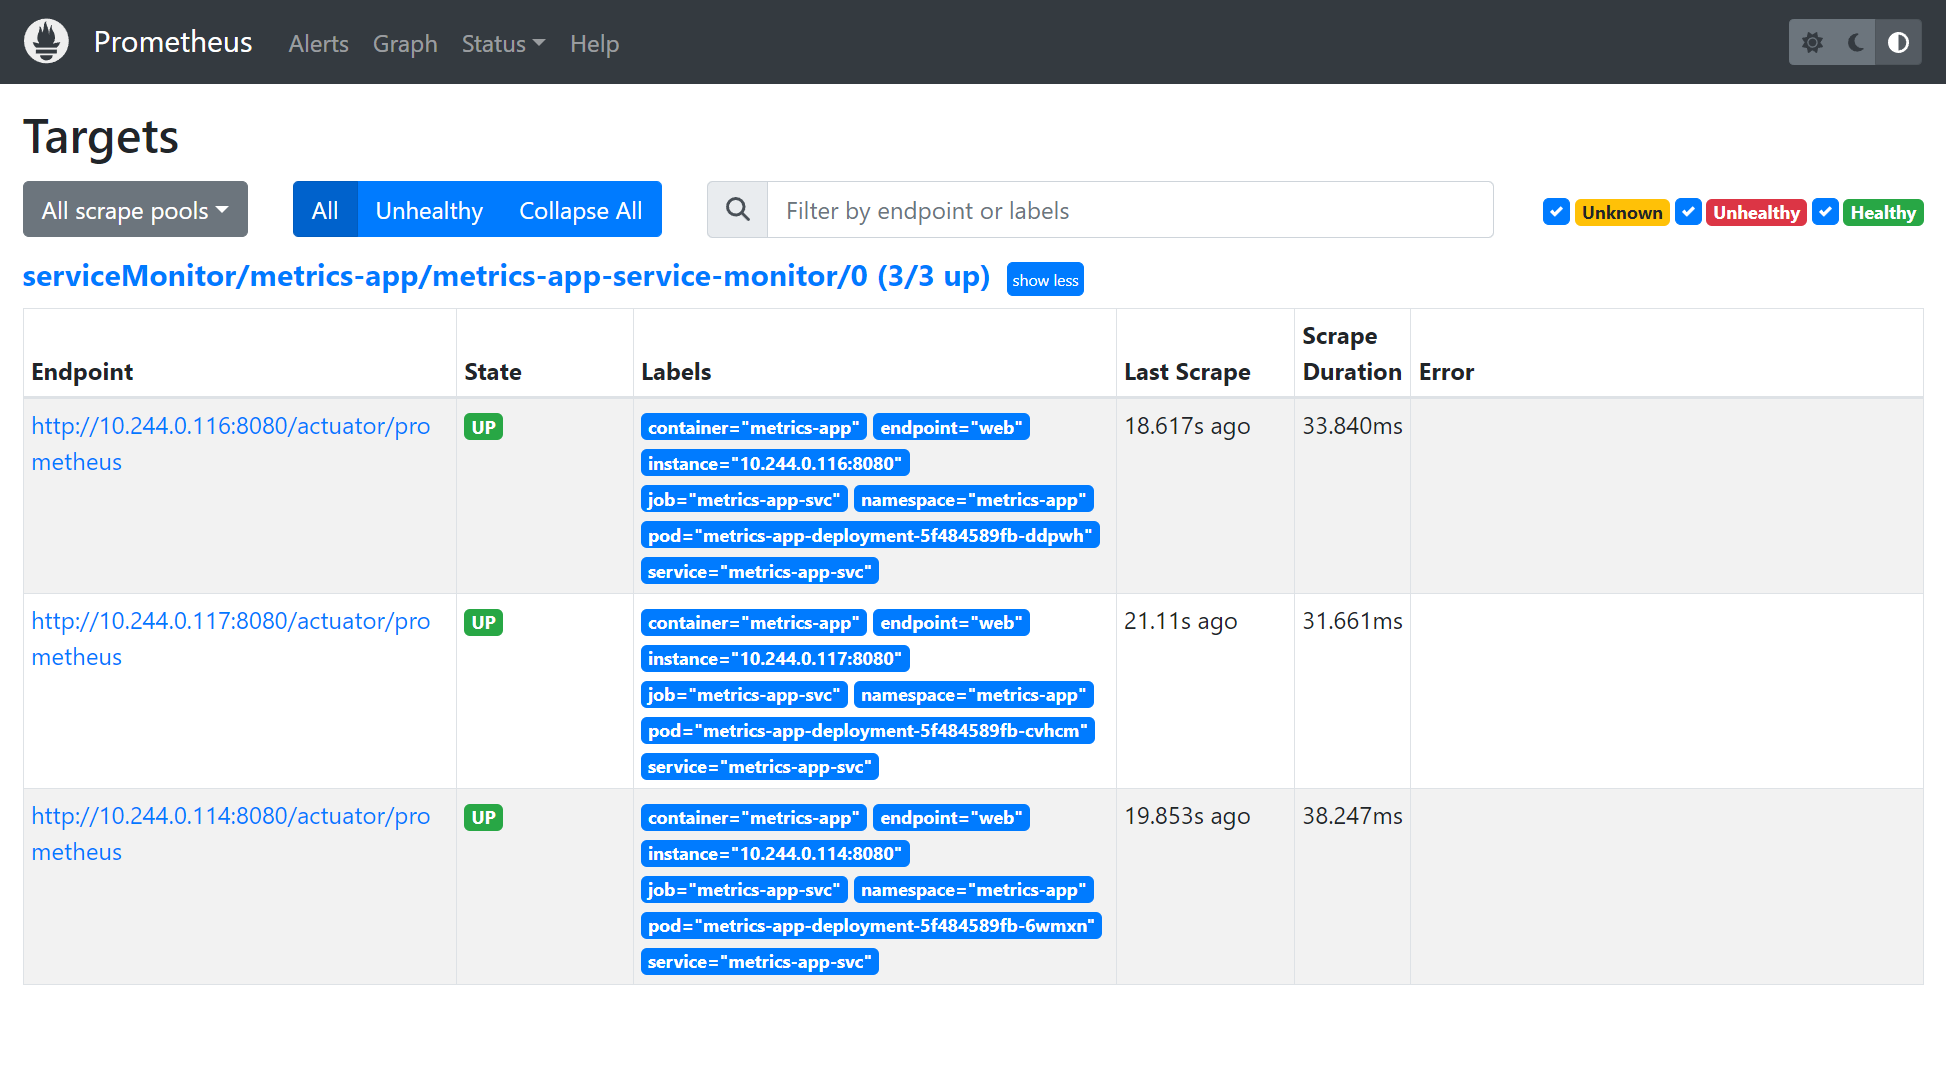
In the Prometheus UI navigate to Status > Targets to see details about resources Prometheus is scraping. You should see something similar to the image below, the metrics-app-service-monitor has been detected and the three pods exposed by the service that the ServiceMonitor selects have been scraped.
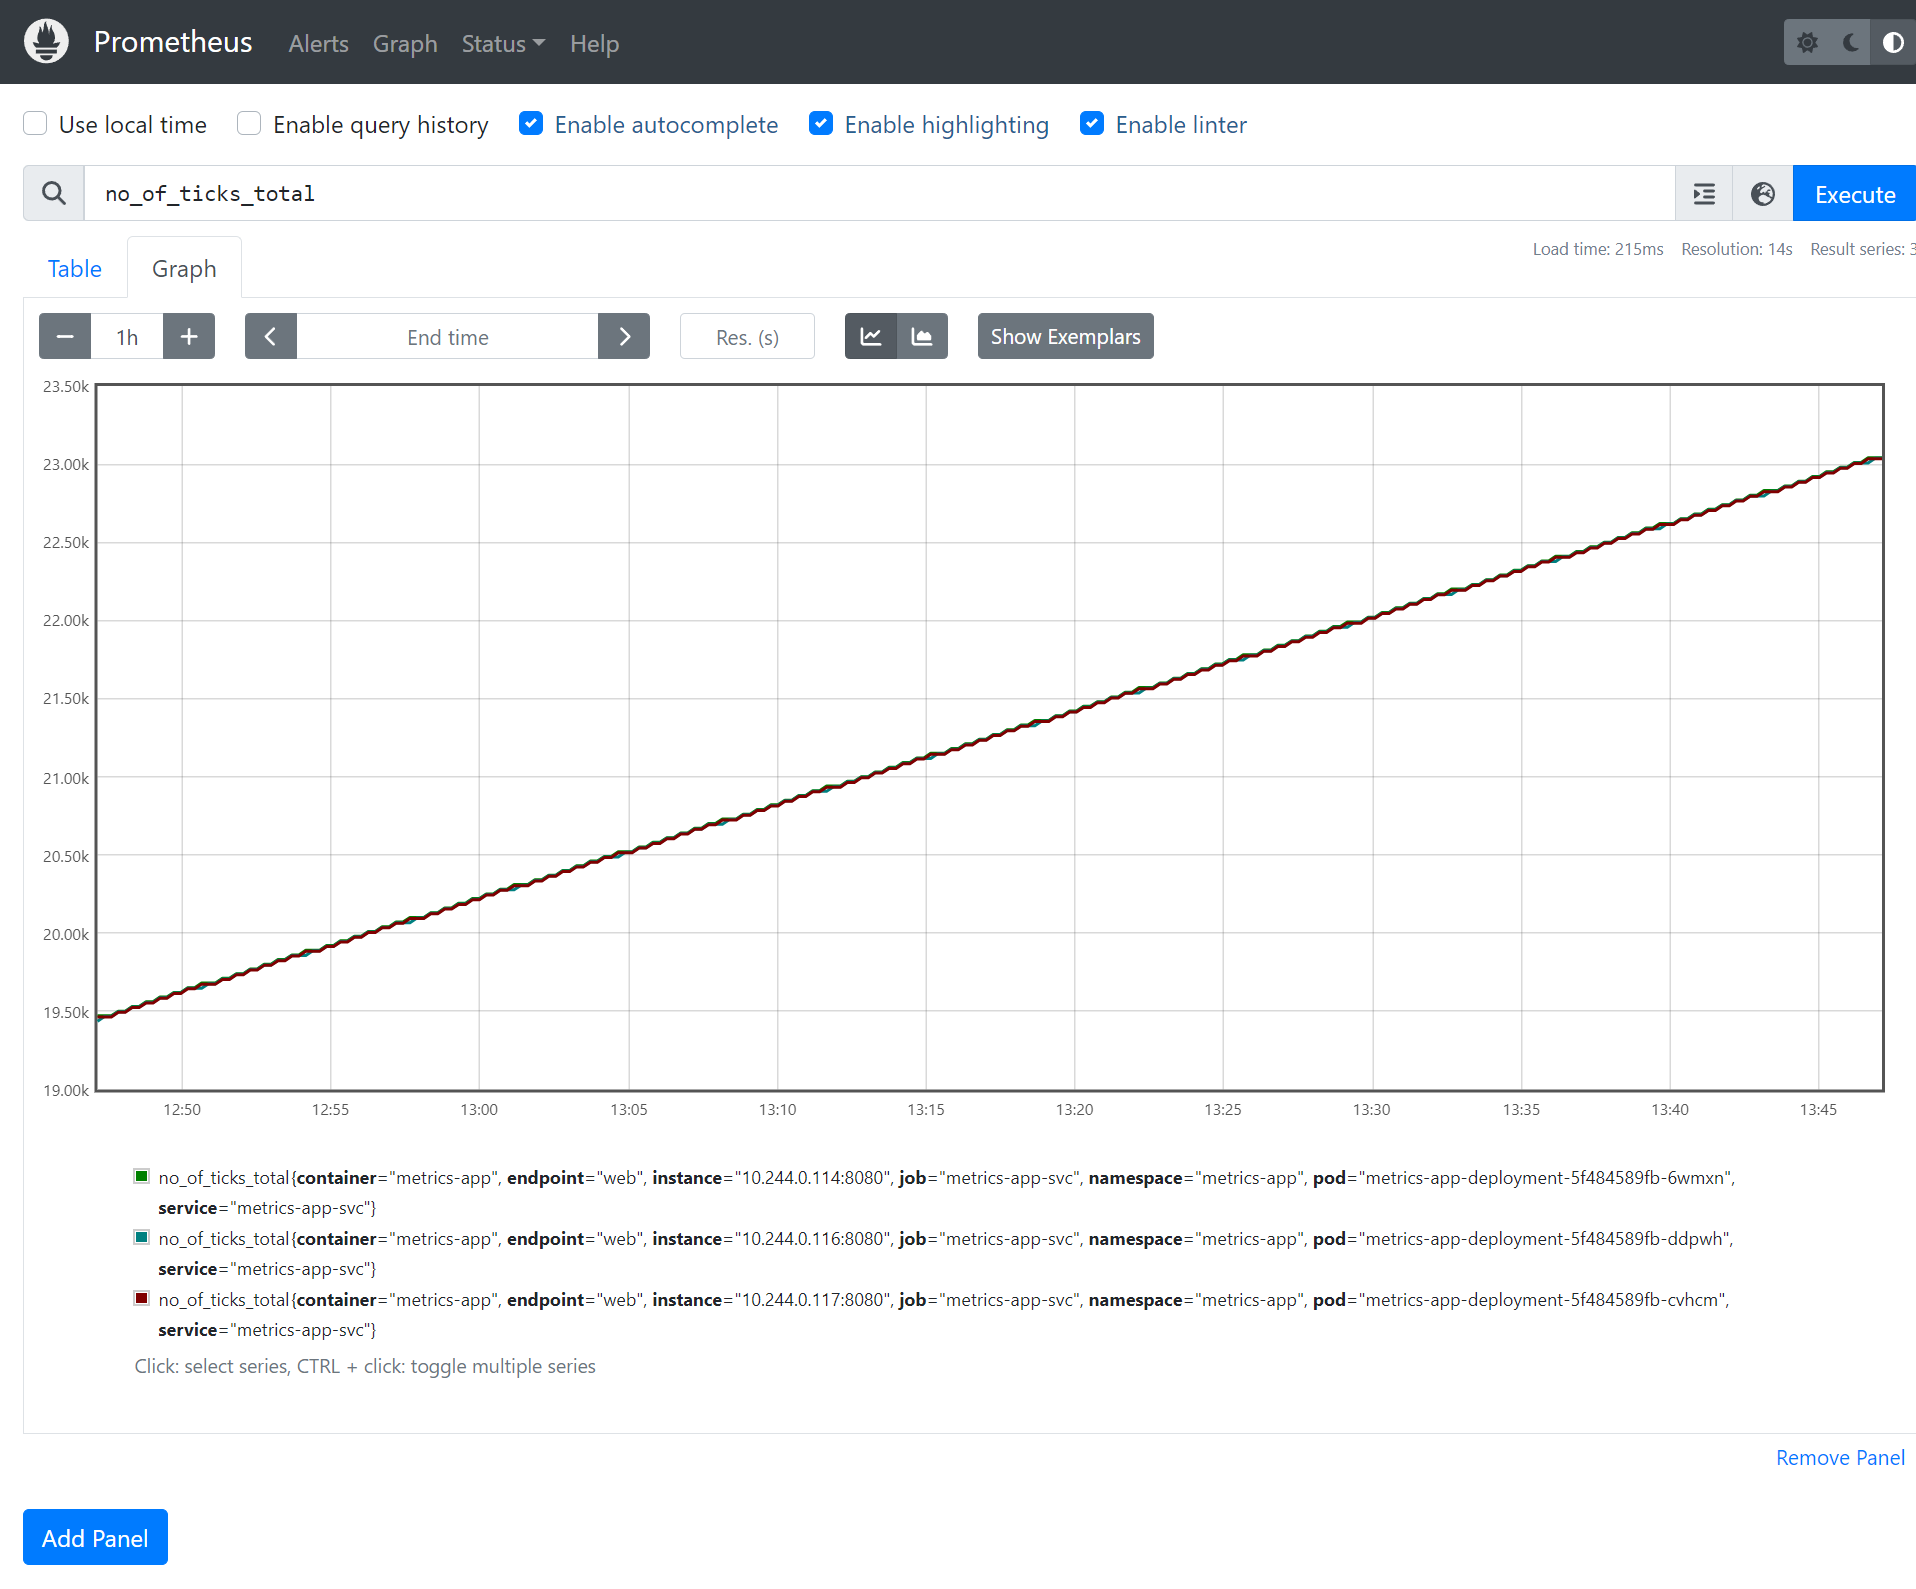
On the graph page, you can type “no_of_ticks_total” into the query textbox to produce a chart the of no_of_ticks_total metric.