Spring Boot Monitoring with Prometheus, Micrometer, and Actuator
In this article, we’ll add metrics to a Spring Boot application using Micrometer and make them available to a Prometheus server using Actuator.
Monitoring Introduction
Monitoring is the process of collecting, and analysing information from a system to track how well it is performing the task it is designed to perform. Typically, monitoring focuses on key indicators such as throughput, latency, resource utilisation, etc. Changes in these metrics usually indicate a problem but not may not provide enough detail to resolve the issue which is where observability comes in.
Demo Restaurant Application
We’ll add monitoring to a simple restaurant application to demonstrate the built-in metrics and some custom metrics of different types. The application allows customers to create an order and restaurant staff to complete orders. We’ll add monitoring for the total number of orders, number of active orders, and order completion time.
Check out the full example on GitHub https://github.com/minibuildsio/springboot-prometheus-example.
Required Dependencies and Configuration
We need to add dependencies for Actuator and Micrometer with Prometheus support.
- Actuator is a sub-project of Spring Boot that makes adding health, metrics, etc endpoints simple.
- Micrometer is a library that provides a simple API for collecting and exposing metrics.
- Prometheus is an application that allows you to collect and query metrics. Prometheus requires the metrics to be provided in a particular format, Micrometer can provide metrics in Prometheus format (as well as many other formats).
implementation 'org.springframework.boot:spring-boot-starter-actuator'
runtimeOnly 'io.micrometer:micrometer-registry-prometheus'
To expose the Prometheus endpoint we need to add the following to the application configuration in application.yaml.
management:
  endpoints:
    web:
      exposure:
        include: health, prometheus
Accessing the Metrics using the Prometheus Endpoint
With the setup above in place, you’ll be able to view the Prometheus metrics at /actuator/prometheus. The Prometheus format is fairly easy to read each line contains the metric name, some additional info e.g. uri, status codes, etc, and the metric value. E.g.
# HELP http_server_requests_seconds
# TYPE http_server_requests_seconds summary
http_server_requests_seconds_count{method="POST",status="200",uri="/createOrder",} 5.0
http_server_requests_seconds_sum{method="POST",status="200",uri="/createOrder",} 0.1094915
...
Spring Boot automatically provides metrics for memory usage, cpu usage, http requests, etc. A particularly handy default metric is http_server_requests_seconds which is a summary of the duration of all requests to the application. The sample above tells us that the /createOrder endpoint was successfully posted 5 times and the total duration of all requests was ~0.1 seconds.
Custom Metrics
Metric Types
Prometheus supports four types of metrics:
- Counter: A single numerical value that always increases. Good for answering questions like “How many orders have been processed?”.
- Gauge: A single numerical value that can go up and down. Good for answering questions like “How many active orders are currently being processed?”
- Histogram: A set of counters grouped into buckets. Good for answering questions like “How many orders were processed in less than 5 minutes?”.
- Summary: Similar to a histogram but with fixed percentiles rather than buckets.
A histogram can transformed into a percentile summary using PromQL using the histogram_quantile function e.g.
histogram_quantile(0.95, sum(rate(http_request_duration_seconds_bucket[5m])) by (le))
The benefit of the summary over the histogram metric is if you’re only interested in a handful of percentiles (e.g. 0.5, 0.75, 0.95, 0.99) the output of the summary is much smaller and doesn’t require calculation to get the percentiles.
The Code
To start with we need to provide our application with a MeterRegistry which is the object that allows us to register our metrics. We can do this in a regular configuration class like so:
@Configuration
public class ApplicationConfig {

    @Bean
    public MeterRegistry meterRegistry() {
        return new CompositeMeterRegistry();
    }
}
With the MeterRegistry created we can set up the custom metrics using counter(), gauge(), for the DistributionSummary.builder(...).
- To create a counter call
meterRegistry.counter(...)passing in the metric name. - To create a gauge call
meterRegistry.gauge(...)passing in the metric name and an object that implementsNumbere.g.AtomicInteger. - To create a histogram use
DistributionSummary.builder(...)passing in the metric name and callpublishPercentileHistogram().
You can add a list of tags to the metrics if you need to add metadata to the metrics for more granular summaries.
@Service
public class OrderService {

    List<Order> orders = Collections.synchronizedList(new ArrayList<>());

    private final Counter totalOrders;
    private final AtomicInteger activeOrders;
    private final DistributionSummary orderCompletion;

    public OrderService(MeterRegistry meterRegistry) {
        totalOrders = meterRegistry.counter("no.of.orders");
        activeOrders = meterRegistry.gauge("no.of.active.orders", new AtomicInteger(0));
        orderCompletion = DistributionSummary.builder("order.completion.seconds")
                .publishPercentileHistogram()
                .register(meterRegistry);
    }
    ...
}
If you were only interested in a set of percentiles you could add publishPercentiles(0.5, 0.75, 0.95) to the builder spec for order.completion.seconds, converting it into a summary rather than a histogram.
To increment the counter simply call increment() optionally passing a number if you want to increment by something other than 1. To set the gauge call set(...) passing a number you want to set the gauge to.
public Order createOrder(List<String> items) {
    Order order = new Order(UUID.randomUUID().toString(), items, LocalDateTime.now());
    orders.add(order);

    totalOrders.increment();
    activeOrders.set(orders.size());

    return order;
}
To record an observation for a histogram metric call record(...) passing in the observed value e.g. order during.
public void completeOrder(String id) {
    Order order = orders.stream()
            .filter(o -> o.id().equals(id))
            .findFirst()
            .orElseThrow();

    orders.remove(order);

    Duration orderDuration = Duration.between(order.createdDateTime(), LocalDateTime.now());
    orderCompletion.record(orderDuration.getSeconds());

    activeOrders.set(orders.size());
}
Running a Prometheus Instance using Docker Compose
With Spring Boot configured to output metrics, we need to spin up an instance of Prometheus to periodically collect the metrics and build a queryable time-series.
The docker-compose file below will spin up a prom/prometheus container with the prometheus.yml configuration file mounted in the expected location.
version: "3.3"
services:
  prometheus:
    image: prom/prometheus
    ports:
      - "9090:9090"
    volumes:
      - ./localenv/prometheus.yml:/etc/prometheus/prometheus.yml
The prometheus.yml configuration file sets the scrape interval and URI to scrape. host.docker.internal refers to the localhost of the host machine which is where the Spring Boot application is running.
global:
  scrape_interval: 15s

scrape_configs:
  - job_name: 'Spring Boot scrape'
    metrics_path: '/actuator/prometheus'
    static_configs:
      - targets: ['host.docker.internal:8080']
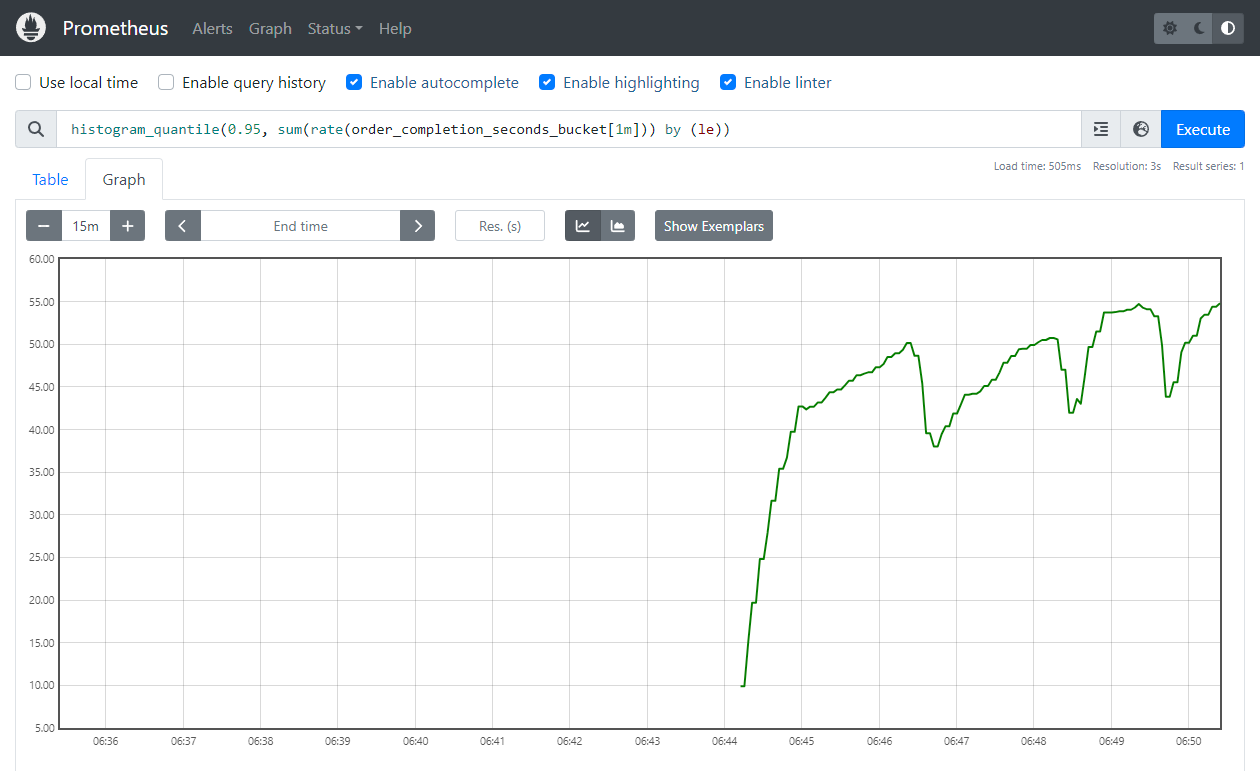
Prometheus Queries
Prometheus provides a query language called PromQL that allows you to query and aggregate your metric time-series. PromQL has a bunch of built-in functions to calculate sums, rates, percentiles, etc.
The Prometheus UI allows you to experiment with PromQL queries and visualise their output as tables or charts. The statement below calculates the 95 percentile of order completion times over a 1-minute window.
histogram_quantile(0.95, sum(rate(order_completion_seconds_bucket[1m])) by (le))
The query should render a chart that looks like this: